
iSBets: The Fastest Frontend in African iGaming
iSBets: The Fastest Frontend in African iGaming
iSBets: The Fastest Frontend in African iGaming
In the iGaming industry, performance is not a nice-to-have — it is a competitive advantage that directly impacts player acquisition, retention, and revenue. At iSolutions, we have always believed that a platform should meet players where they are, not where we wish they were.
Today we are sharing the results of our latest performance benchmark, comparing the iSBets frontend against six major competitors across the African iGaming market. The data was collected from Google PageSpeed Insights using real-user field data (Chrome User Experience Report), not synthetic lab tests. The results confirm what we have been engineering towards: the fastest frontend in the market.
Our Methodology: Isolating Frontend Speed
Standard page speed metrics can be misleading. A platform hosted closer to its users may appear faster simply because data travels a shorter distance, while its actual frontend code is no better. To isolate true frontend rendering performance, we measure how long it takes for the page to appear on screen after the browser receives the first byte from the server. This strips away intercontinental latency, revealing how efficiently the frontend code itself renders the page.
This approach gives operators and technical decision-makers a fair, apples-to-apples comparison of frontend engineering quality — regardless of where each platform is hosted around the world.
Page Rendering Speed: iSBets Leads the Market
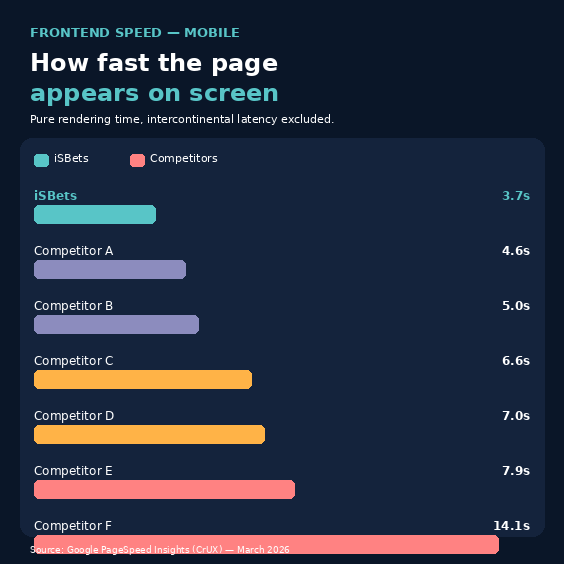
With a rendering time of just 3.7 seconds on mobile, iSBets delivers the fastest frontend among all seven platforms tested. The next closest competitor comes in at 4.6 seconds — nearly a full second slower. At the other end of the spectrum, the slowest competitor takes 14.1 seconds to render its main content. That is almost four times slower than iSBets.
Here is the full ranking across all tested platforms:
- iSBets: 3.7s — fastest in the benchmark
- Competitor A: 4.6s
- Competitor B: 5.0s
- Competitor C: 6.6s
- Competitor D: 7.0s
- Competitor E: 7.9s
- Competitor F: 14.1s
Tap Responsiveness: Critical for Live Betting
Speed is not just about how fast a page loads — it is also about how fast it reacts. Tap response time measures the delay from when a user taps or clicks to the moment the browser shows a visual response. For live betting, where odds change in real time and every millisecond counts, this is a critical metric.
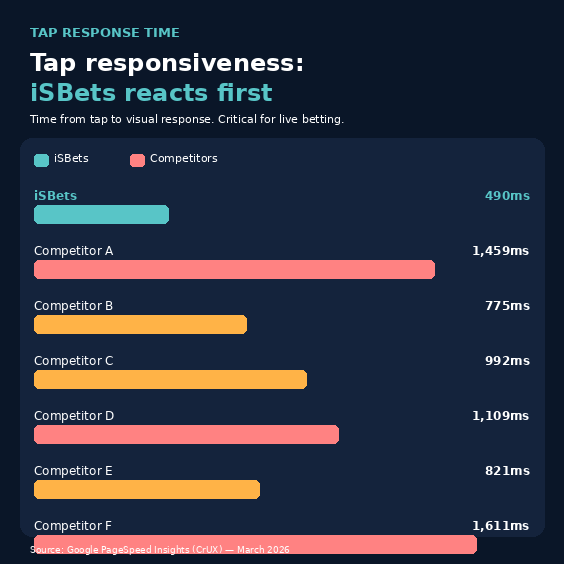
iSBets achieves a tap response time of just 490 milliseconds — dramatically better than every competitor tested. The next best is Competitor B at 775ms, and several competitors exceed one full second of delay before the interface reacts to a tap. At those speeds, players can literally miss a bet.
Why This Matters: Context Is Everything
Africa's digital landscape is one of the most exciting in the world. Mobile penetration is growing rapidly, internet connectivity is expanding, and a young, tech-savvy population is driving innovation across every sector. But building for this market means understanding — and respecting — its specific characteristics.
- Mobile-first reality: the vast majority of players access iGaming platforms via mobile. Many use capable but affordable devices. A frontend that only performs well on high-end hardware excludes most of the potential audience.
- Tap speed drives revenue: in live betting, the interval between tapping "place bet" and seeing confirmation is the difference between a completed wager and a missed opportunity. iSBets' 490ms tap response means players react and the platform keeps up.
- Visual stability matters: iSBets also leads in visual stability — meaning the page does not jump around while loading. Some competitors shift content so aggressively that players may tap the wrong button.
- Every metric compounds: a platform that loads fast, reacts fast, and stays stable creates a fundamentally different player experience. That experience translates directly into longer sessions, higher engagement, and better retention.
The Full Comparison
Here is the complete benchmark data across all key metrics, with our overall rating:
- iSBets: Rendering 3.7s / Tap speed 490ms / Rating: 5 stars
- Competitor A: Rendering 4.6s / Tap speed 1,459ms / Rating: 4.5 stars
- Competitor B: Rendering 5.0s / Tap speed 775ms / Rating: 4 stars
- Competitor C: Rendering 6.6s / Tap speed 992ms / Rating: 3.5 stars
- Competitor D: Rendering 7.0s / Tap speed 1,109ms / Rating: 3 stars
- Competitor E: Rendering 7.9s / Tap speed 821ms / Rating: 2.5 stars
- Competitor F: Rendering 14.1s / Tap speed 1,611ms / Rating: 2 stars
How We Achieve This
The performance advantage of iSBets is not accidental. It is the result of deliberate architectural decisions made with the end user in mind from day one. Our frontend is built with a lightweight-first philosophy: every asset is optimised, every request is minimised, and every component is designed to render and respond as fast as possible — even on constrained devices and slower connections.
Key technical choices that drive our performance include aggressive code splitting and lazy loading, optimised image formats and compression, server-side rendering with intelligent caching, minimal JavaScript bundles designed for low-powered devices, and event handling optimised for sub-second interaction response times.
Looking Ahead
Performance optimisation is not a one-time achievement — it is a continuous commitment. We are constantly monitoring real-user metrics, testing new optimisation strategies, and ensuring that as our platform grows in features, it never grows in load time or response latency.
Our goal remains simple: to deliver the best possible experience to every player, regardless of their device, connection speed, or location. Because that is what they deserve.
Benchmark data collected from Google PageSpeed Insights (Chrome User Experience Report — real-user field data), March 2026. Rendering time = total page load time minus intercontinental latency (LCP minus TTFB), isolating pure frontend speed. Tap speed = time from user interaction to visual response (INP metric). All values represent the 75th percentile as reported by CrUX. Competitor names anonymised.
Related News